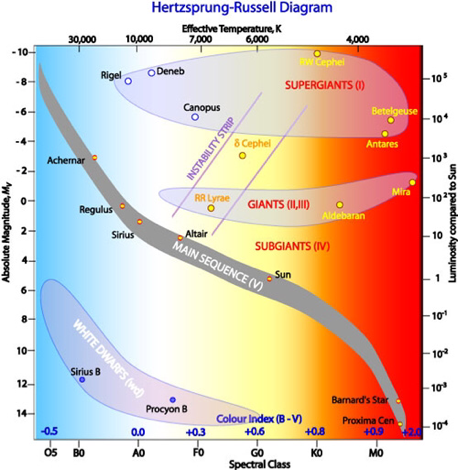
HERTZSPRUNG-RUSSELL DIAGRAMHertzsprung-Russell Diagrams represent the various stages of stellar evolution. Each star is represented by a dot on the diagram. The horizontal position of the star represents it's average surface temperature, where as the vertical position represents the stars absolute magnitude (luminosity). Astronomers use the Hertzsprung-Russell to estimate a stars stage of life by simply determining its position on the diagram. The most prominent feature of the diagram is the main sequence of stars, which runs from the bottom left (cool, dim) of the diagram to the top right (hot, bright). Our sun is the basis of this diagram, as it is 1 on the absolute magnitude scale, 6000 degrees and has a yellow spectral class.
The Hertzsprung-Russell diagram displays how near stars are to their death, for example, Rigel, the hottest star depicted in the diagram. There are two types of Hertzsprung-Russell diagrams, theoretical- comparing temperature and luminosity, and observational- comparing spectral class and magnitude. Main sequence stars fuse hydrogen atoms to form helium atoms in their cores. About 90 percent of the stars in the universe, including the sun, are main sequence stars. The diagram shows the life cycle of stars from main sequence stars and supergiants to white dwarf and Giants, representing the various stages of Stella evolution. |
Australian Telescope National Facility, 2011, Stellar Evolution. CSIRO, 13th September.
http://www.atnf.csiro.au/outreach/education/senior/astrophysics/stellarevolution_hrintro.html |
